Build a code graph with Graphify
A Knowledge can ingest an entire Git repository and turn it into a code graph: every file, symbol, and relationship in the codebase becomes a navigable part of the Knowledge. Graphify analyzes the repository, fills the Knowledge with structured resources, installs an interactive graph viewer, and gives the Knowledge chat a tool that answers questions about the code. This guide takes you from a clone URL to a Knowledge you can browse and query.
Graphify is a code-analysis engine. It parses a repository and builds a graph where nodes are files and symbols (functions, classes, and so on), edges are the relationships between them (defines, references, calls), and communities are clusters of files that belong together. In Rational AI, Graphify is a processing rule you select when attaching a Git Source to a Knowledge — the graph it produces is the Knowledge's content.
Prerequisites
Before you start, make sure you have:
- Access to the AI Control Room Settings area, for both Sources and Knowledge.
- An HTTPS clone URL for the repository you want to ingest — for example
https://github.com/id-Software/DOOM.git. - For a private repository: the credentials needed to create a Git credentials connector for the repository host. Public repositories need no connector.
Create a Git repository Source
The repository enters the platform as a regular Source. Nothing about the Source itself is Graphify-specific — the same Source could feed other Knowledge bases with other rules.
- Go to Settings → Sources and create a Git repository Source.
- Enter the Repository URL (an HTTPS clone URL).
- For a private repository, create a Git credentials connector for the repository host and select it under Credentials (optional). Leave it empty for a public repository.
- Optionally set Branch, tag, or commit — leave it blank to use the repository's default branch — and turn on Include Git submodules if the repository uses them.
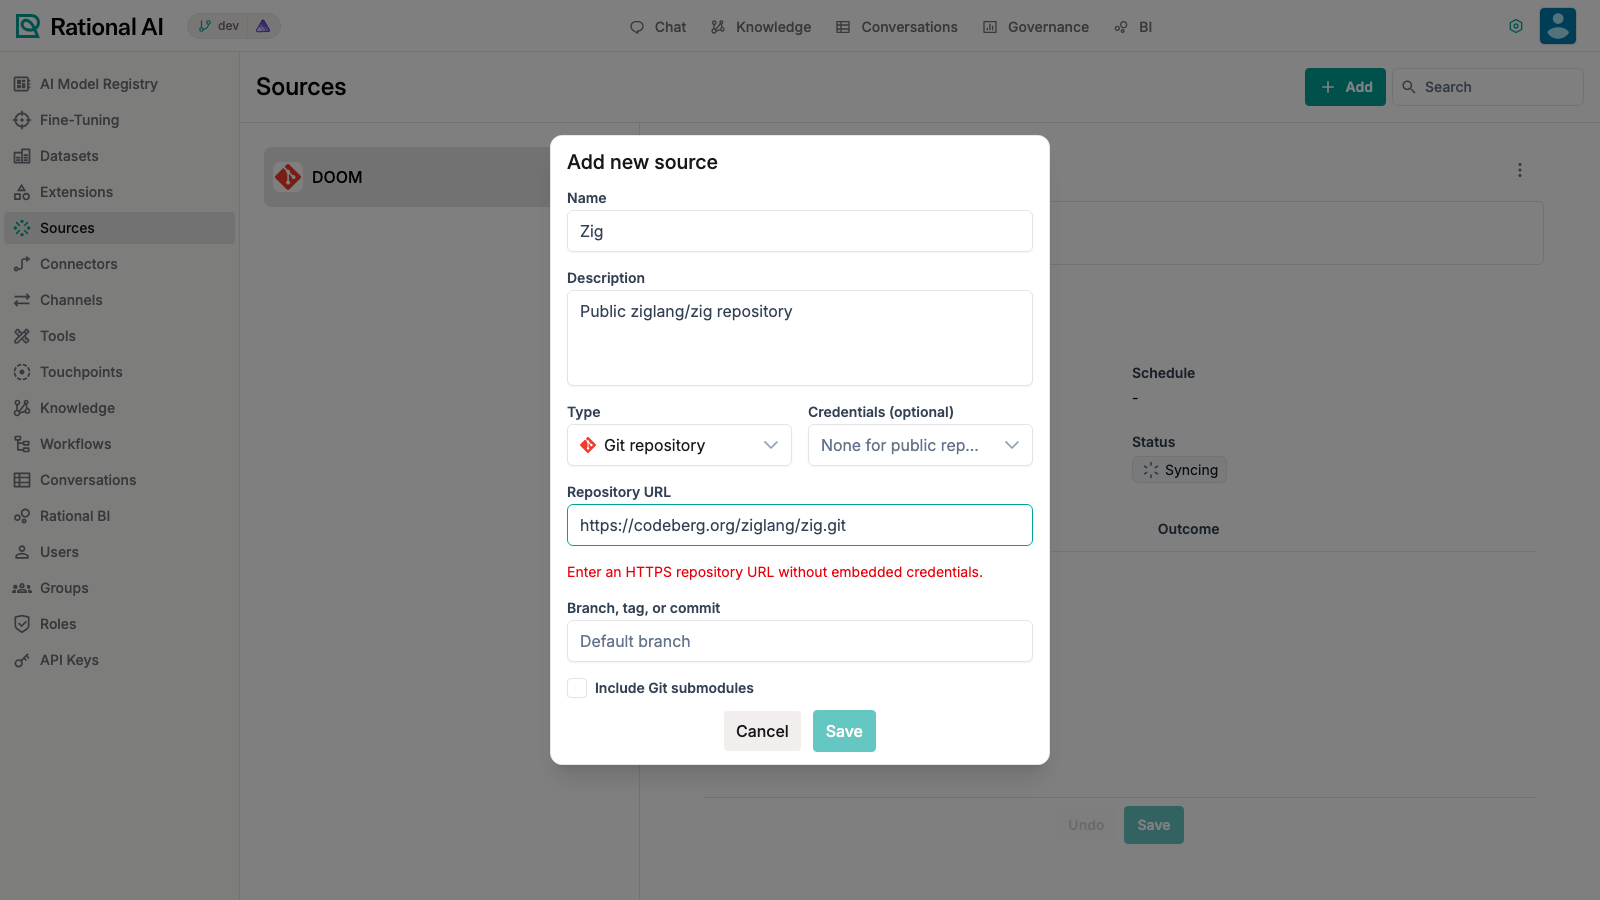
Adding a Git repository Source: the clone URL, optional credentials, and an optional branch, tag, or commit.
Attach the Source with the Graphify rule
Graphify comes into play when the Source is attached to a Knowledge: the Processing rule you pick decides how the repository is processed.
- Create a Knowledge (or open an existing one) and attach the Git repository Source.
- Select Graphify repository as the Processing rule.
- Start the Knowledge Source sync and wait for processing to complete.
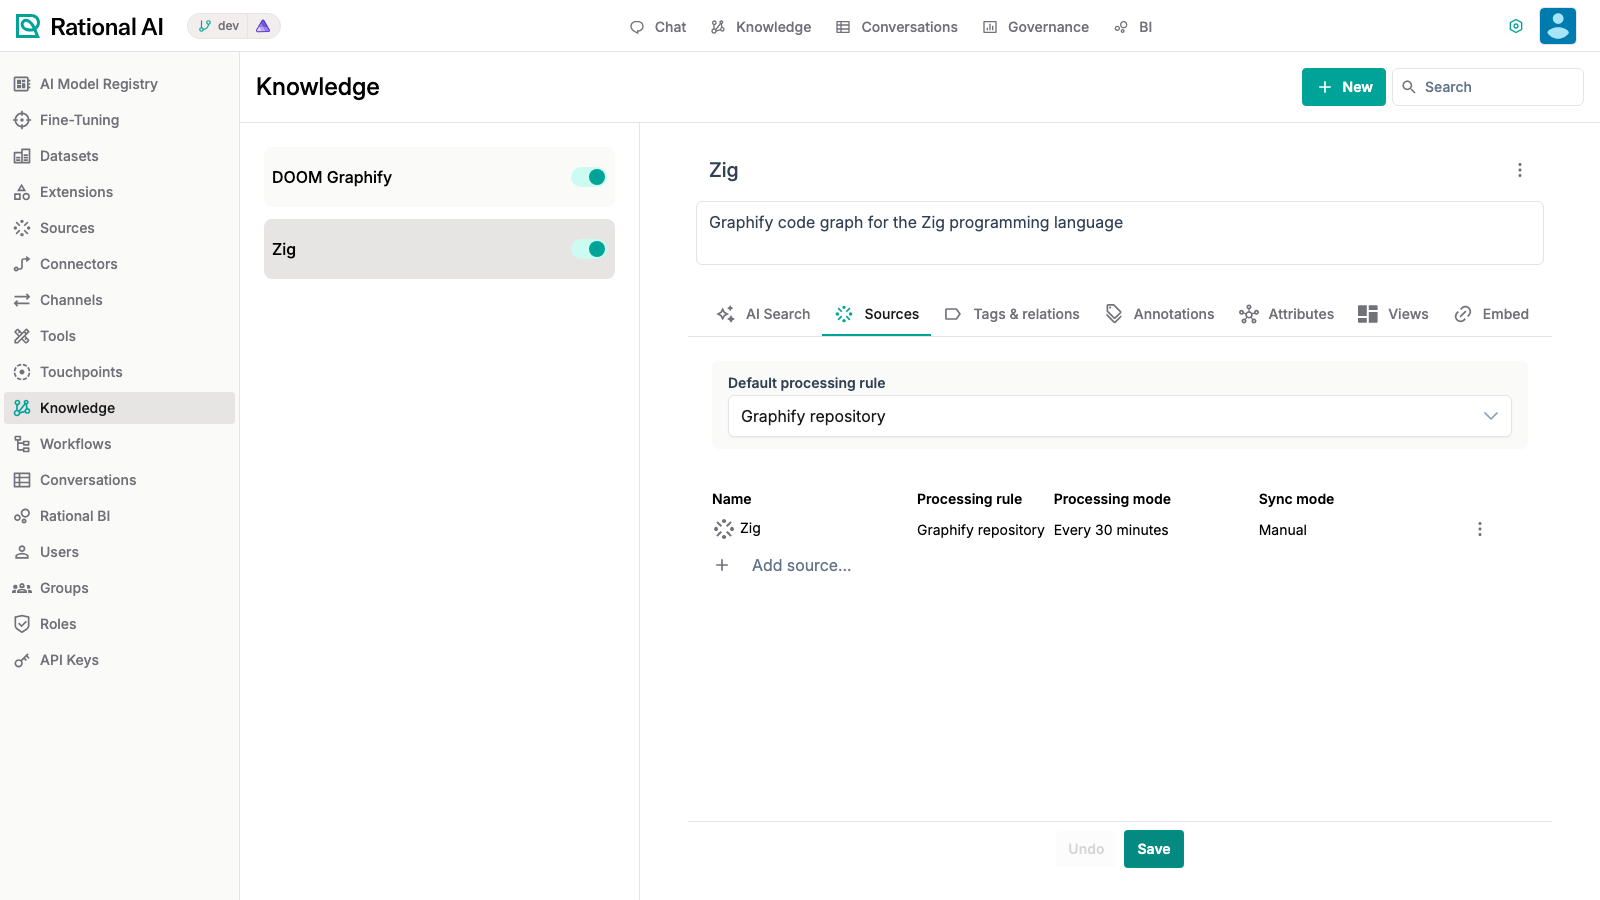
The Knowledge's Sources tab: the Git Source attached with Graphify repository as its processing rule.
You don't need to synchronize the Source separately before processing. If the Source has never been synchronized, starting the Knowledge Source sync runs the Source sync first, then continues on its own through snapshot creation, graph generation, and view installation.
A Graphify Knowledge maps to a single Git repository: the generated graph represents one codebase. To analyze several repositories, create one Graphify Knowledge for each.
What processing produces
During the sync, the repository is checked out, snapshotted, and analyzed by Graphify. The generated graph (graphify-graph.json.gz) is stored with the Knowledge, and its contents are materialized as resources and relations:
| Category | What it holds | Relations |
|---|---|---|
| Overview | A single codebase overview resource. | — |
| Workspace | One resource per workspace (top-level area) of the repository. | — |
| Code files | One resource per analyzed file, categorized by its workspace. | references between files that use each other. |
| Community | A cluster of files that Graphify groups together. | contains the files in the cluster. |
| Symbol | A significant function, class, or other symbol. | defined_in the file that declares it. |
The Graphify rule is a dedicated processing path. It does not chunk, embed, or index the code for RAG — questions are answered by querying the graph directly, so the answers reflect the code's actual structure rather than text similarity.
Explore the graph
Processing also installs Graphify's interactive viewer as a custom view on the Knowledge page. Open the Knowledge and switch to the Graphify view to explore the graph visually — files, symbols, communities, and the edges between them. The resources themselves behave like any other Knowledge content: browse them in the standard views, filter by category, and follow relations from the resource details panel.
Ask questions about the code
The Knowledge's Touchpoint is equipped with the query_graph tool. When you chat with the Knowledge, each question is answered by running Graphify's query engine against the stored graph — on demand, with no server left running between questions.
For a Knowledge built from the public DOOM repository, try:
Where is the main game loop implemented?
The graph locates D_DoomLoop() in linuxdoom-1.10/d_main.c, along with the functions it calls.
Result
Your Knowledge now contains a full code graph of the repository: an overview, workspaces, files, symbols, and communities linked by their real relationships, an interactive viewer to explore them, and a chat that answers questions from the graph. When the repository changes, run the Knowledge Source sync again to rebuild the graph.
To let coding agents such as Claude Code or Codex query this graph from outside the Control Room, see Use Graphify from an external MCP client.