Monitor usage, cost, and audit logs
Once your AI is in use, you'll want to know how much it's being used, what it's costing you, how fast it responds, and exactly what happened on any given request. The Governance area gives you all of that in one place.
Governance is a top-navigation area (alongside Chat, Knowledge, Conversations, and BI) that reports on your AI's usage. It answers three practical questions: how much am I spending, where is it slow or expensive, and what exactly did the model do on a specific call? It has three tabs: Dashboard for the big picture, Applications for the inventory of what is calling your AI, and Audit log for the call-by-call record.
Before going further, two terms show up everywhere in this area:
- An inference is a single call to a model: one question in, one answer out.
- A token is the small chunk of text that models read and write, and the unit they're billed by. A short sentence is a handful of tokens; a long document is thousands. (For more on the models behind these calls, see LLMs.)
Read the dashboard
Open Governance and you'll land on the Dashboard tab. It reads top to bottom, from the headline numbers to the detail behind them.
The Overview row gives you the totals for the period you've selected, at a glance:
- Total costs — what your AI usage has cost over the period (for example, €210.41).
- Total inferences — how many model calls were made.
- Total input tokens — the volume of text sent into the models.
- Total output tokens — the volume of text the models generated back.
Next to the featured Total tokens chart sit two cards that put those totals in context:
- Cost composition — the spend that isn't per-call: Provider subscriptions and Infrastructure runtime captured in the period. Review provider costs → takes you to where that pricing is configured.
- Governance health — Cost coverage (how much of your usage Rational AI can actually price), Unpriced requests, Error rate, and Cache hit rate.
The Performance details section below plots the rest over time, so you can see trends rather than just a single number:
- Tokens per second (avg) — how fast the models are generating text.
- Inferences — call volume over the period.
- Tokens per inference (avg) — how large your typical request-and-response is.
- Costs — spend over time.
- Cost per inference (avg) — the average price of a single call, useful for spotting an expensive model or touchpoint.
- Time to first token (avg) — how long, on average, before a response starts coming back.
The page closes with Top applications, the most active application tags seen through the proxy, with their status, environment, requests, tokens, and cost. View all opens the full inventory — see Govern AI applications.
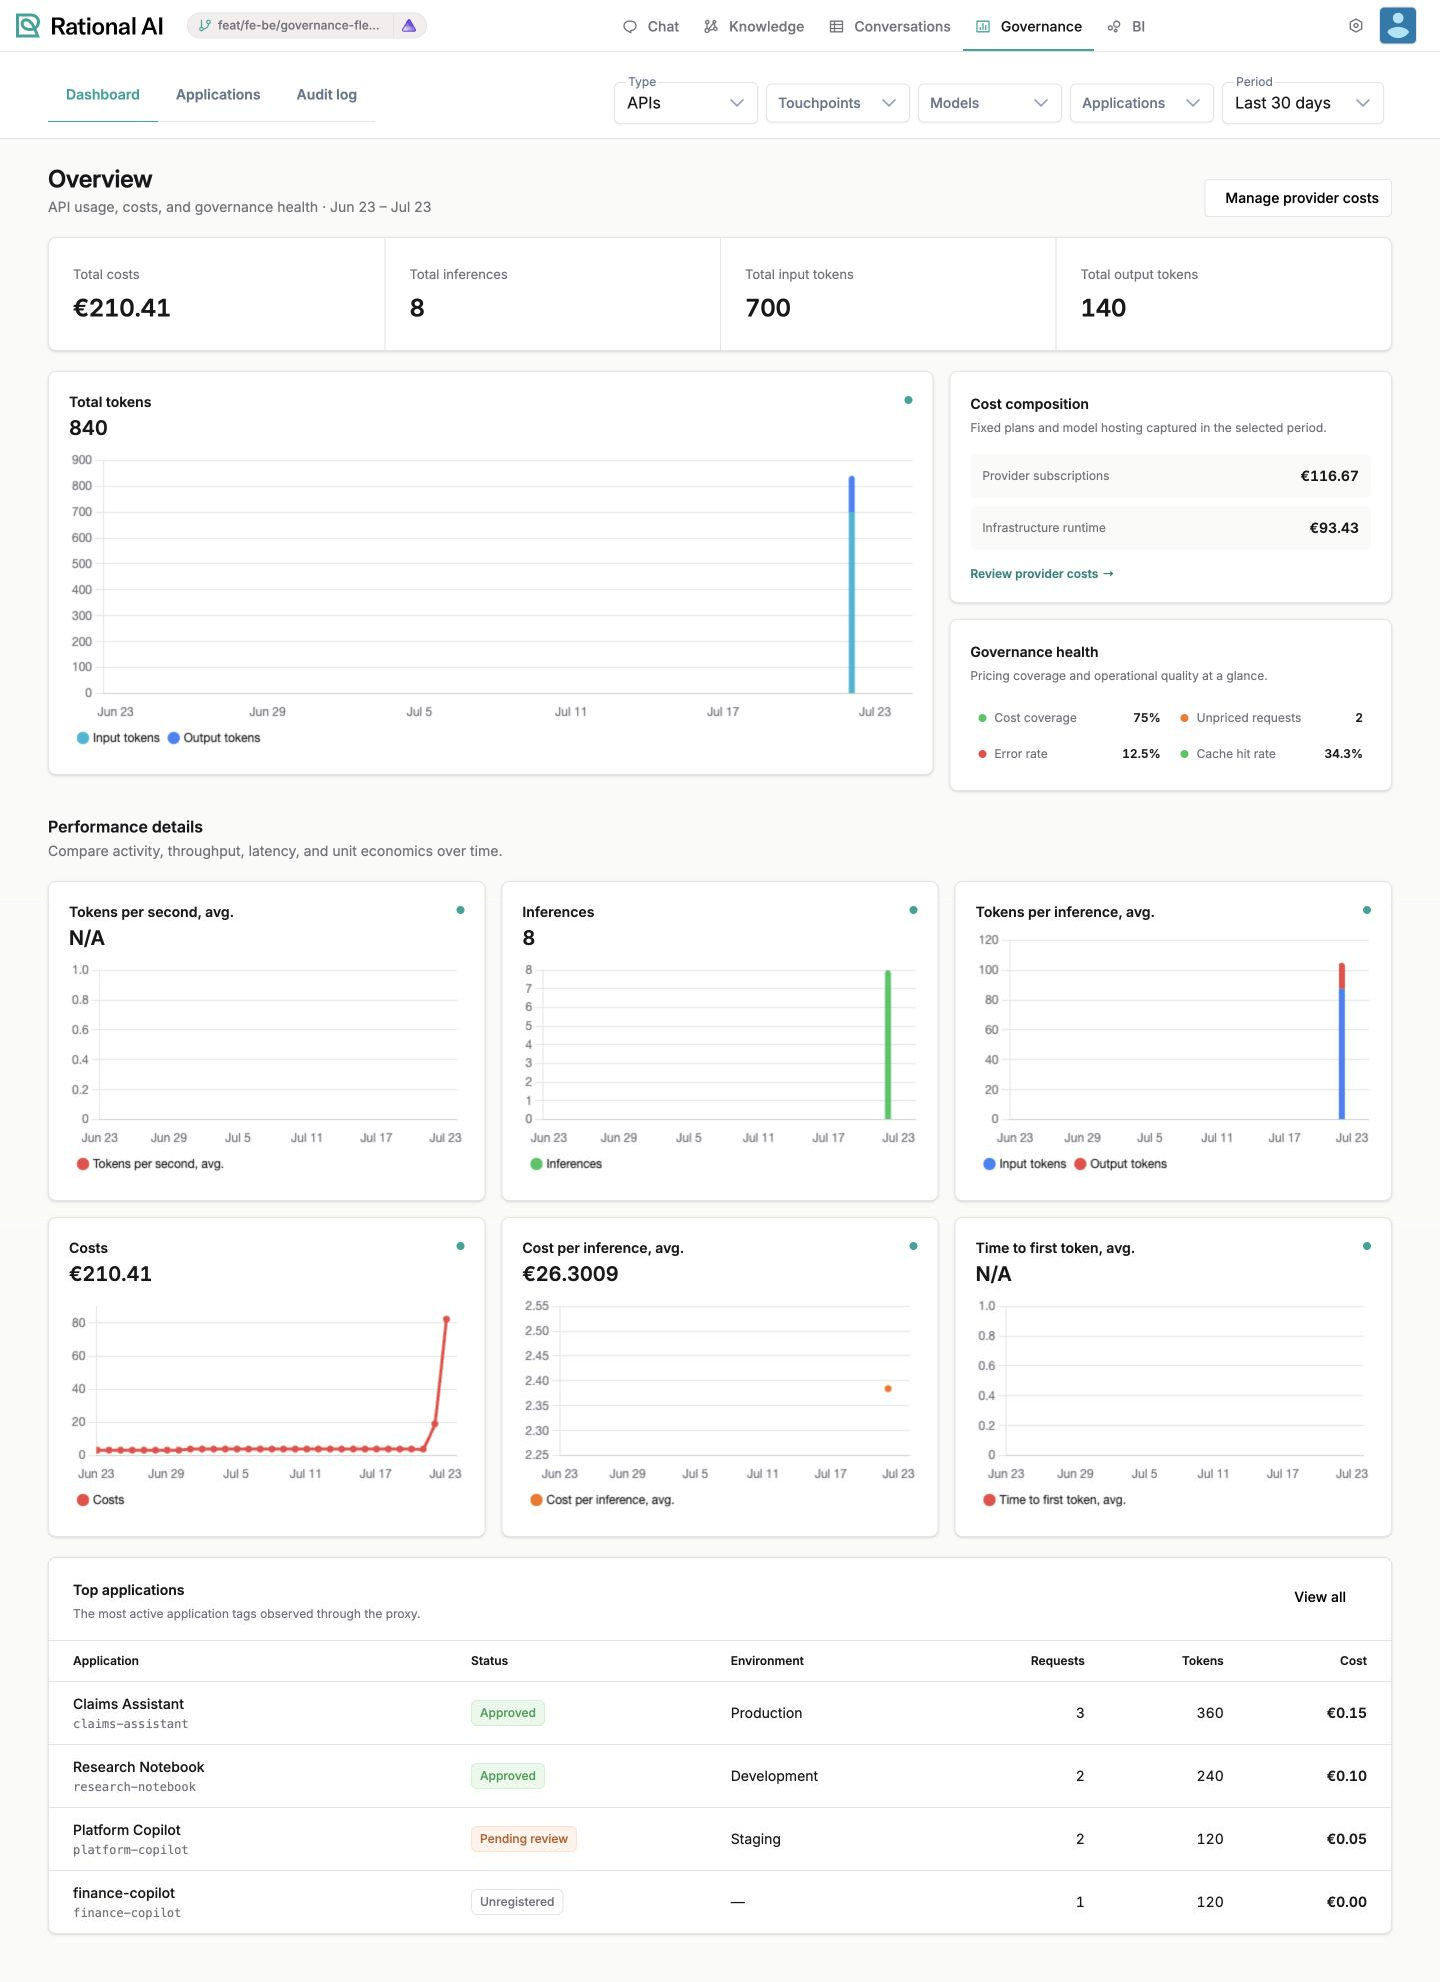
The Governance Dashboard: totals for the selected period, cost composition and health beside the featured chart, per-metric charts below, and the top applications at the foot.
Tokens per second and Time to first token are measured while a response streams. A period made up entirely of non-streaming calls has nothing to average, so those cards truthfully show N/A rather than a zero you might mistake for "instant".
Filter what you're looking at
Across the top of the page sit five filters that scope everything you see — both the cards and the charts, on any tab:
- Type — narrow to a kind of usage: APIs or Conversational.
- Touchpoints — focus on one or more touchpoints (the entry points your users actually talk to).
- Models — focus on specific models from your AI Model Registry.
- Applications — focus on specific governed applications calling through the proxy.
- Period — set the time window, for example Last 30 days.
Cost composition, governance health, top applications, and the Applications filter describe proxy traffic, so they appear with Type set to APIs. Switch to Conversational and the dashboard changes to usage, engagement, and quality signals instead.
These filters are how you turn a broad overview into a real answer. Want to know which touchpoint is driving spend? Set Period to the last 30 days and switch Touchpoints one at a time while you watch the Costs chart. Suspect one model is slow? Filter to it and check Time to first token (avg).
Inspect individual calls in the audit log
When you need to look past the averages at a single call, switch to the Audit log tab. It's a sortable, paginated table with one row per inference — a complete record of every call your AI has made within the current filters.
Two similarly-named surfaces answer different questions:
- Audit log (this tab) — one row per model call: which model, how many tokens, what it cost, how fast. It's about the AI doing work.
- Audit trail (Settings → Audit trail) — one row per access or change to a record: who opened a conversation, who deleted a user. It's about people reaching data.
If someone asks you to evidence who looked at a record, this tab is not the answer — the audit trail is.
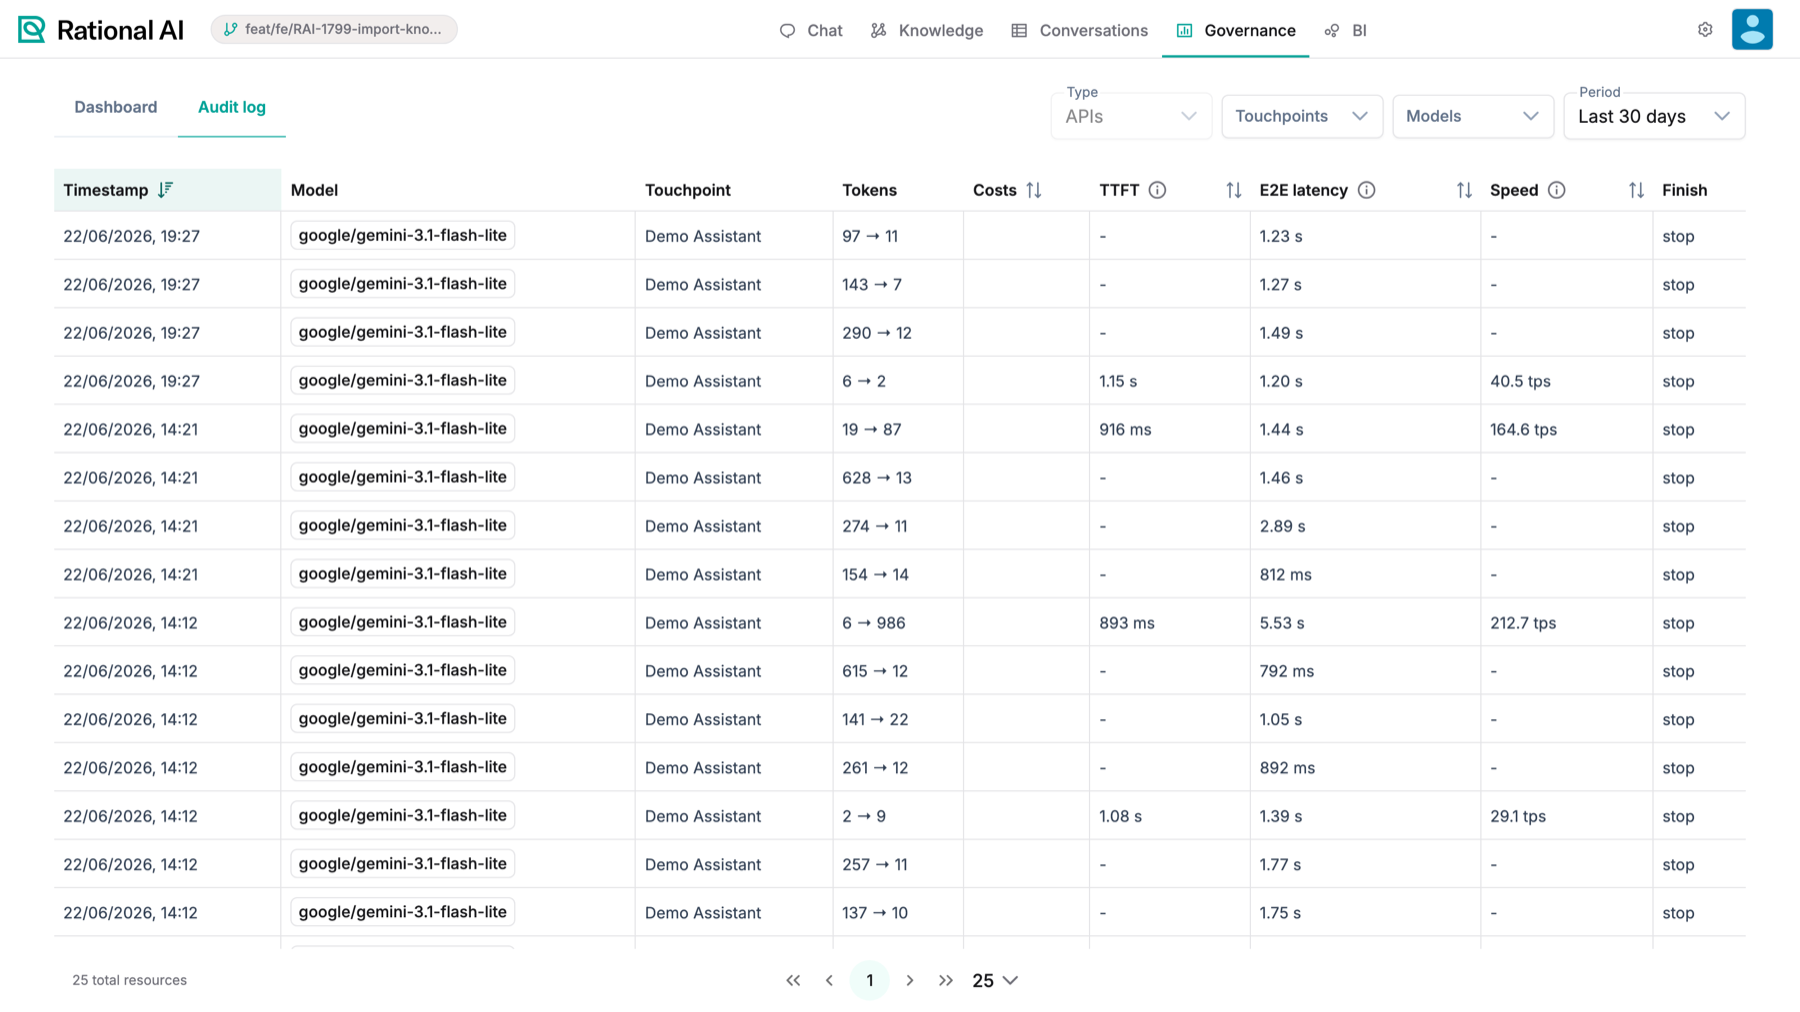
The Audit log: one row per inference, with the model, touchpoint, token counts, cost, and latency.
Each column tells you one thing about the call:
- Timestamp — when the call happened.
- Model — which model handled it.
- Application — the governed application the call was attributed to.
- Proxy — which proxy it went through.
- Touchpoint — which entry point the call came through.
- Tokens — the count in, then out (input → output).
- Costs — what that single call cost.
- TTFT — time to first token: how long until the first piece of the answer came back. This is what a user experiences as the "wait" before a response starts.
- E2E latency — end-to-end latency: the total time from request to the last token.
- Speed — generation rate in tokens per second.
- Finish — why the call ended, for example
stop(the model finished its answer normally).
Click a column header to sort. Sorting by Costs surfaces your most expensive calls; sorting by TTFT or E2E latency brings the slowest ones to the top.
A captured call records the request's headers, and the values of credential headers are redacted before anything is written. The header name is kept — knowing a request carried an Authorization header is useful when reading a trace back — but the token itself never reaches the database. This isn't configurable, and it applies regardless of whether a model has tracing switched on.
The prompt and response bodies are a separate matter: they're only recorded when a model has tracing enabled, and how long they live is governed by your retention policy.
These two measure different kinds of "slow." A high TTFT means the model took a while to start answering — the user stares at a blank screen. A high E2E latency with a low TTFT usually just means a long answer that streamed steadily. When a touchpoint feels sluggish, check TTFT first.
The table keeps itself current: new calls appear as they are captured, without reloading the page or touching a filter. To take the record elsewhere, select Export to download the rows matching your current filters as a CSV. The button is disabled when the filters return nothing to export.
Only the audit table refreshes on its own. The Dashboard charts still load when you change a filter, so a dashboard you left open all afternoon shows the picture as of the last time you touched it — change the Period (or reload) to bring it up to date.
Result
You now know where to track spend and performance over time on the Dashboard, how to use the Type, Touchpoints, Models, Applications, and Period filters to scope to exactly what you care about, and how to drill into any single call in the Audit log — which refreshes as calls arrive and exports to CSV — to see its tokens, cost, and latency. To turn the application names in those tables into an owned, priced inventory, continue with Govern AI applications.